
Research question
What does this evidence show within this research scope: Chicago city, nine-county metro, 15 selected ZIPs and published platform measures?
Chicago city accounted for most of the reported metro inventory decline, but ZIP, transaction-stage and source-definition differences rule out a single market headline.
Executive summary
- Chicago city accounted for 62.2% of the nine-county metro's August year-over-year inventory decline, despite representing 29.3% of the prior-year inventory base. The rest of the metro declined 5.9%, compared with the city's 23.3% decline.
- Twelve of 15 reviewed ZIPs had lower inventory, but the sample's annual inventory changes spanned 87.44 percentage points. Two shrinking-inventory ZIPs nevertheless had longer reported market time.
- July MRED detached contracts rose while closings fell. The observation supports separating transaction stages; it does not establish a conversion rate or predict future closings.
- Public price and migration headlines require separate populations and periods. No blended Chicago price or actual-migration estimate is created.
Scope and assumptions
Illinois REALTORS city and nine-county metro reports both cover August 2026 and are current as of September 8. Their consistently nested geography is assumed for count subtraction. The residual is labeled metro excluding Chicago city, not a named suburban market. The counties are Cook, DeKalb, DuPage, Grundy, Kane, Kendall, Lake, McHenry and Will.
The MRED PDF retrieved during research covers July 2026, current as of August 14. It is retained as a historical companion. Realtor.com's 15 individual ZIP pages all returned August-labeled summaries. The city page carried a September summary heading and August chart endpoints, with different values from those individual summaries. The ZIP study does not mix these snapshots.
1. Most of the metro inventory loss was inside the city
| Geography | August 2025 inventory | August 2026 inventory | Change in count | Change in percent |
|---|---|---|---|---|
| Chicago city | 4,616 | 3,541 | -1,075 | -23.29% |
| Metro excluding city, derived | 11,140 | 10,487 | -653 | -5.86% |
| Nine-county metro | 15,756 | 14,028 | -1,728 | -10.97% |
Original calculations: city share of regional decline = 1,075 / 1,728 = 62.21%; city share of prior inventory = 4,616 / 15,756 = 29.30%. The city contributed a much larger share of the inventory reduction than its share of the starting inventory.
This is an accounting decomposition. It does not show whether new listings, withdrawals, closings or other status changes caused the reduction. It also does not establish buyer demand. Subtracting medians would be invalid; no outside-city price median is inferred.
Sources: Illinois REALTORS August 2026 city and metro PDFs. The findings use the reports' current prior-year figures rather than mixing revisions from an older release.
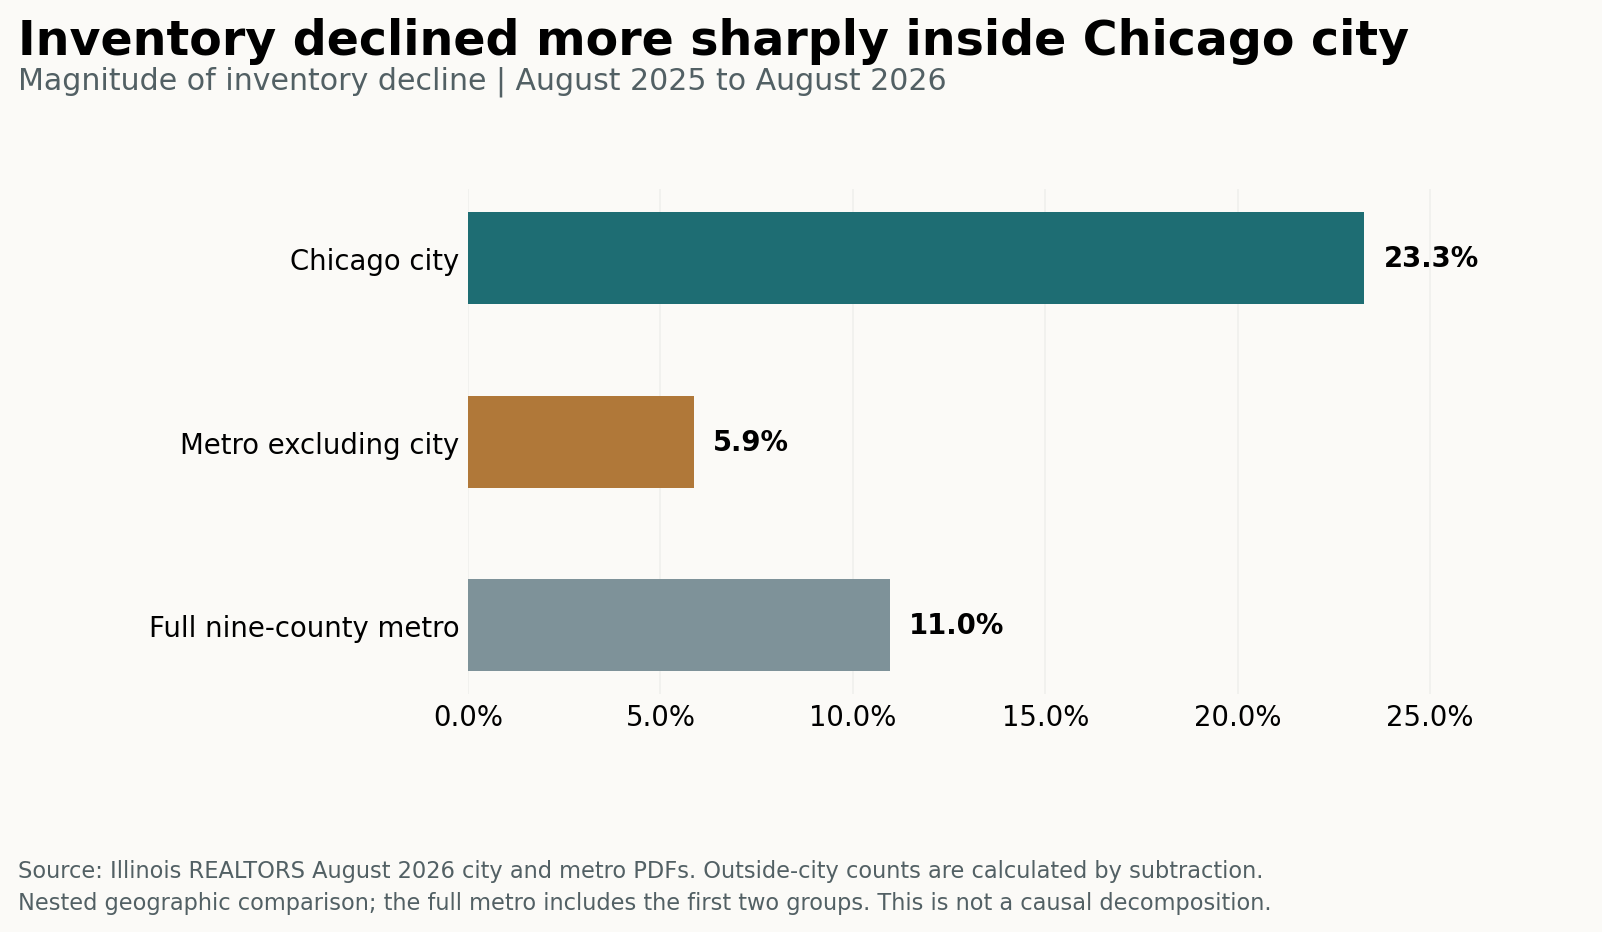
Source: Illinois REALTORS® August 2026 city and metro reports. The full metro includes the first two groups; the comparison assumes nested geography and is not causal.
2. ZIP-level differences remain substantial
Selection rule: the 15 ZIPs appearing in the supplied city page's listing-price comparison table. This is a convenience sample. Each row below comes from the corresponding individual August summary.
| ZIP | Active inventory | Inventory YoY | Median DOM | DOM YoY |
|---|---|---|---|---|
| 60611 | 568 | -16.72% | 48 | -12.50% |
| 60628 | 334 | -15.14% | 45 | -3.66% |
| 60636 | 320 | +62.03% | 52 | +57.14% |
| 60621 | 310 | +39.90% | 39 | +19.51% |
| 60619 | 278 | -15.03% | 49 | -26.53% |
| 60617 | 266 | -11.31% | 41 | -16.28% |
| 60620 | 250 | -9.34% | 46 | +7.25% |
| 60637 | 257 | -6.39% | 41 | -26.55% |
| 60609 | 215 | -7.96% | 57 | +36.11% |
| 60614 | 244 | -14.53% | 29 | -4.17% |
| 60618 | 177 | -25.41% | 33 | -18.18% |
| 60643 | 166 | -16.47% | 34 | -11.84% |
| 60657 | 197 | -17.84% | 31 | -4.55% |
| 60647 | 207 | -4.74% | 32 | -4.35% |
| 60623 | 173 | +16.78% | 48 | -4.90% |
Twelve ZIPs had declining inventory; three had growing inventory. Ten of the twelve declining-inventory ZIPs had shorter reported market time. The exceptions are 60620 and 60609. The spread between +62.03% and -25.41% is 87.44 percentage points.
Counts of ZIP directions are unweighted. No all-city inference, neighborhood desirability ranking, demographic explanation or causal effect is assigned. Sold-median movements are retained as raw source observations but not ranked as appreciation; transaction counts and property mix are missing.
Source: Realtor.com Economic Research, individual ZIP summaries. Exact links and extraction fields are included in the data files and source register.
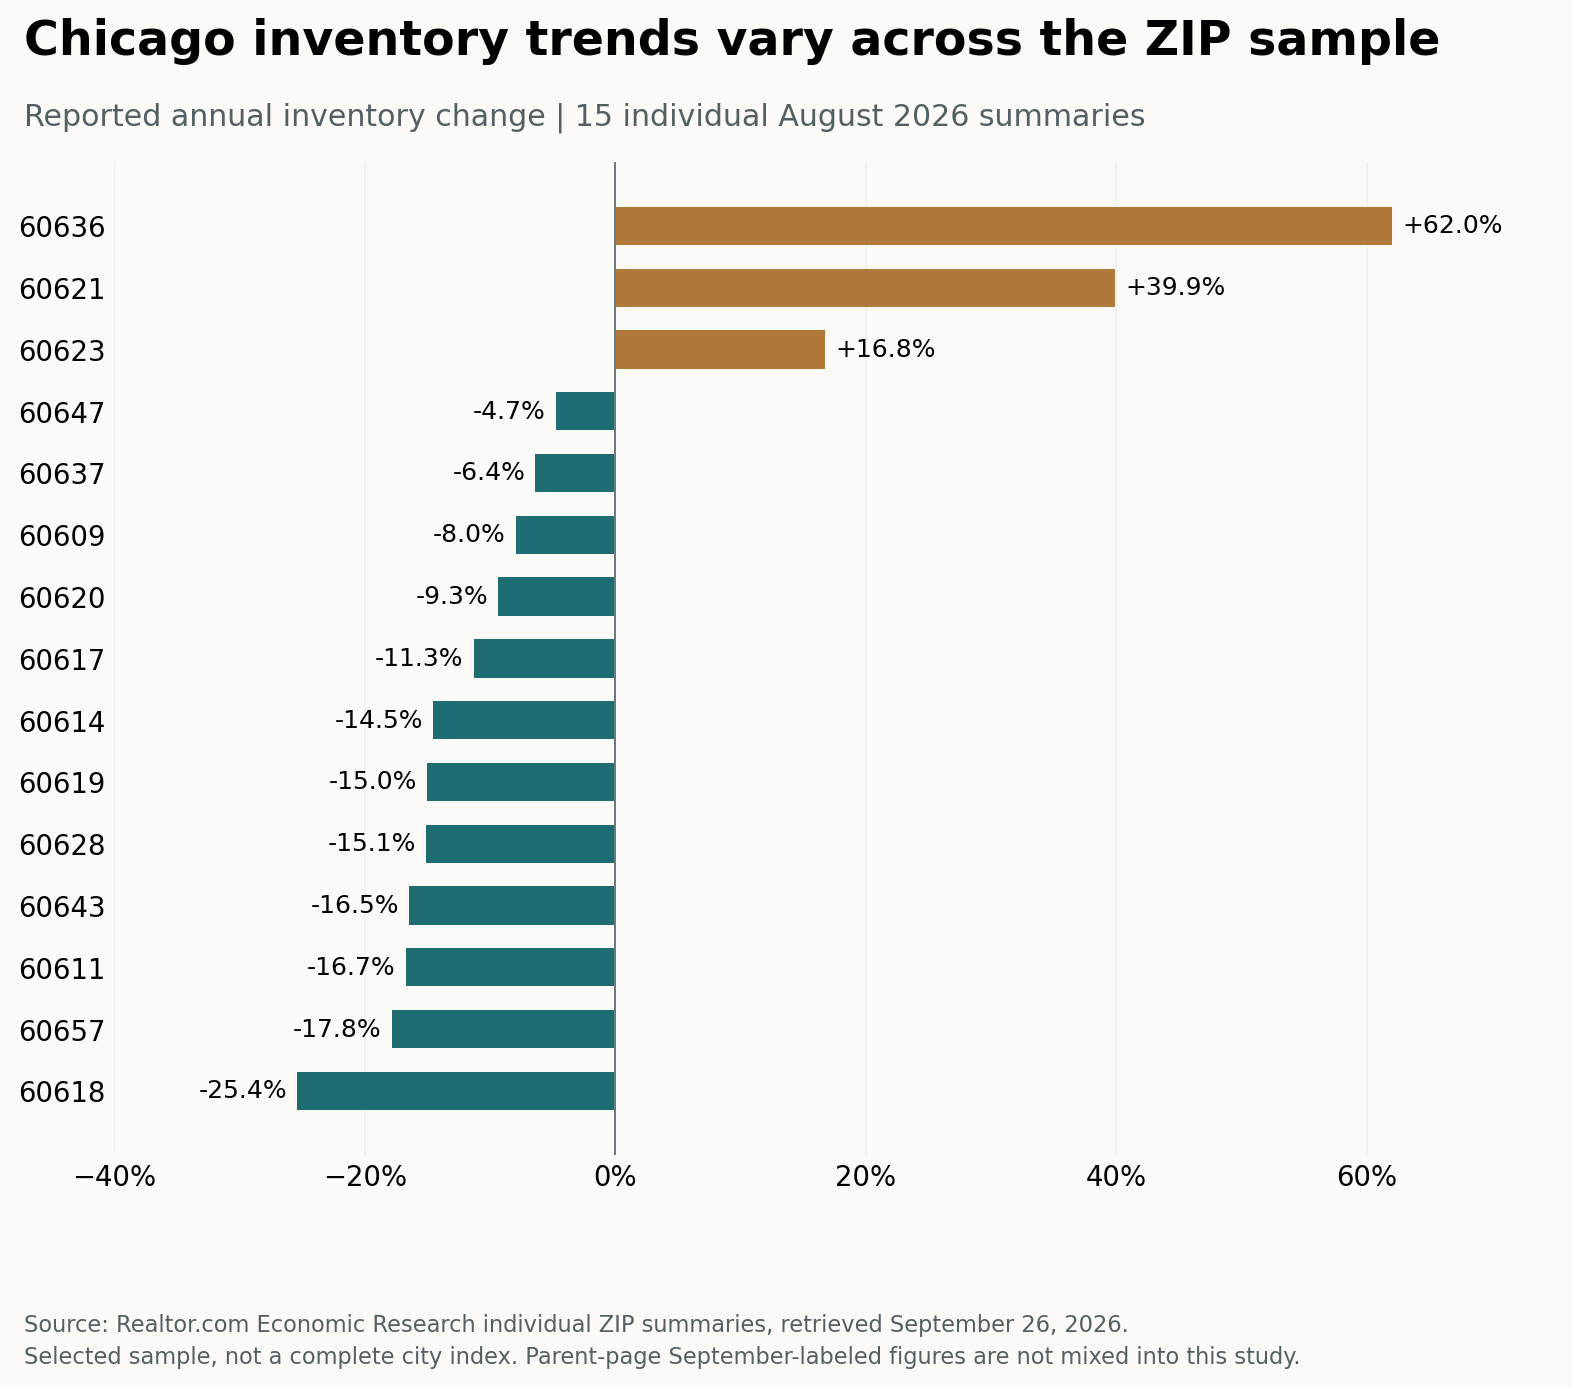
Realtor.com Economic Research, individual August 2026 summaries. The preceding table lists all 15 selected ZIPs; this is not an all-Chicago or neighborhood ranking.
3. July's contract and closing measures diverged
| MRED category | Under contract, 2025 to 2026 | Calculated change | Closings, 2025 to 2026 | Calculated change |
|---|---|---|---|---|
| Detached single-family | 675 to 695 | +2.96% | 822 to 714 | -13.14% |
| Attached single-family | 1,166 to 1,174 | +0.69% | 1,379 to 1,433 | +3.92% |
These are July measures at different transaction stages. They are not a linked cohort, so dividing one by the other would not produce a conversion rate. The source's under-contract label includes contingent and pending. Future closings are not forecast.
Source: MRED Chicago Local Market Update, July 2026. MRED and association summaries may share upstream MLS records; their agreement is not independent replication.
4. Portal differences are a measurement finding
| Source | Displayed price | Metric and period |
|---|---|---|
| Zillow | $334,030 | Modeled typical value, August 31 |
| Realtor.com | $390,000 | Sold median; September summary heading / August chart endpoint |
| Illinois REALTORS | $405,000 | Chicago city August sale median |
| Redfin | $426,255 | City sale median; text describes three months ending August |
No blended price is calculated. Realtor.com's $385,000 listing median and $390,000 sold median differ by $5,000, but they describe different populations. The difference is not a matched-property premium. Redfin's volume text mixes monthly and rolling-window language; its displayed sales count is excluded from volume analysis.
5. Search interest describes audiences, not completed moves
Redfin's April-June 2026 Chicago metro section reports 89% of the relevant Chicago search population looking to remain within the metro. New York contributes 320 of the 463 counts in the ten displayed positive net-inflow rows, or 69.11%. Those are different denominators. Neither identifies completed purchases or actual movers.
Whether you are moving within the region or comparing Chicago with another metro, define the housing type, location and complete ownership costs that matter to your search. The search data does not supply matched cost comparisons or establish migration’s effect on prices.
Research limits
The Chicago Association of REALTORS statistics page identifies neighborhood and historical resources, but detailed FastStats and spreadsheets are member resources, and its August article could not be retrieved. No unseen CAR data is claimed. No complete raw MLS database, full historical portal bulk export, property-level matching, causal estimate or statistical significance test was obtained.
Questions this evidence leaves open
A local buyer or seller can use the city, metro and ZIP figures to ask where current alternatives are concentrated and how the relevant property category is moving. The figures do not show why inventory changed or how a specific home will perform. Answering those questions would require linked listing histories across entry, contract, closing and withdrawal within consistent geography, along with original and final asking prices, concessions, relistings, size, construction status, property type and time in status.
For someone comparing Chicago with another metro, the search-interest data identifies a reason to define comparable housing types, geographies, periods and included expenses before comparing costs. It does not supply those matched comparisons. The available evidence supports the distinct city, ZIP, transaction-stage, price-definition and search-denominator findings in this study without turning them into migration, price or demand forecasts.
Sources and methods
Source observations were recorded September 26, 2026. Each finding retains the source’s reporting period; later values on a dynamic URL are not silently substituted into this comparison.
| Source | Reporting period and use |
|---|---|
| Illinois REALTORS® city report | August 2026 Chicago city counts and current prior-year comparison figures; report current September 8 |
| Illinois REALTORS® metro report | Same-period nine-county counts and prior-year figures; report current September 8 |
| MRED Chicago Local Market Update | Retrieved version is July 2026, current August 14; a historical companion at a mutable URL |
| Realtor.com Chicago | September summary heading with August chart endpoints; selected-ZIP list and separate city price context |
| Zillow Chicago | Modeled value through August 31; listing and sale metrics have their own windows, including July sale statistics |
| Redfin Chicago | City price text describes three months ending August; migration section concerns April–June 2026 metro searches |
| Illinois REALTORS® statistics hub | Publisher context and historical resources |
Geographic and calculation rules
- Annual change: (current / prior − 1) × 100. Percentage-point changes subtract percentage readings.
- Outside-city counts: nine-county metro counts minus Chicago city counts, assuming consistent nested geography in the same publisher’s reports. The residual is not a particular suburban market. Median prices are never subtracted.
- City contribution: (4,616 − 3,541) / (15,756 − 14,028) = 1,075 / 1,728 = 62.21%. The prior inventory share is 4,616 / 15,756 = 29.30%. These are count-based accounting comparisons, not causal explanations or demand estimates.
- ZIP directions: unweighted counts within 15 selected ZIPs, chosen from the city page’s listing-price table. They are not a representative all-city estimate. Inventory-change spread = 62.03 − (−25.41) = 87.44 percentage points.
- Search-origin share: 320 / (320 + 40 + 20 + 17 + 15 + 14 + 11 + 11 + 8 + 7) = 69.11%. The denominator is the ten displayed positive net-inflow rows, not all buyers, all searchers or all movers. It differs from the within-metro 89% denominator.
Individual ZIP sources
Attribution: Realtor.com Economic Research. Each linked individual summary supplied August 2026 observations. The parent city page was used for selection, not as a substitute for the individual ZIP values.
- 60611 August-labeled source
- 60628 August-labeled source
- 60636 August-labeled source
- 60621 August-labeled source
- 60619 August-labeled source
- 60617 August-labeled source
- 60620 August-labeled source
- 60637 August-labeled source
- 60609 August-labeled source
- 60614 August-labeled source
- 60618 August-labeled source
- 60643 August-labeled source
- 60657 August-labeled source
- 60647 August-labeled source
- 60623 August-labeled source
For example, the parent page displayed 60618 inventory of 206 and 18 days on market, while the individual August summary showed 177 and 33. The study retains the individual August values. These retrieved representations may be cached and are not asserted to be a live MLS inventory feed.
Limits that matter to a decision
The price figures use different definitions, populations and windows. No blended Chicago price, matched-property premium or discount is calculated. Sold-median changes are not individual-home appreciation; transaction mix and matched repeat sales are unavailable. Redfin’s ambiguous monthly-versus-rolling sales-count field is excluded from volume analysis. Its search sample excludes rentals and uses platform activity criteria; searches do not establish completed moves, purchases or Jeff’s client origins.
MRED and association summaries can share upstream records, so agreement is not independent replication. The analysis does not claim member-only CAR data, a complete raw MLS database, property-level matching, causal estimates, significance tests, investment returns or forecasts. The selected CSV downloads preserve the cited snapshots and calculations with their source fields.
Questions about this research
What question does this research answer?
It examines this scope: Chicago city, nine-county metro, 15 selected ZIPs and published platform measures. The research period is August 2026; July 2026 MRED companion; April-June 2026 search period. Chicago city accounted for most of the reported metro inventory decline, but ZIP, transaction-stage and source-definition differences rule out a single market headline.
Can this research set a price or offer for a specific property?
No. This is point-in-time research for the stated scope; a property-specific decision still requires current comparables, the property's condition, and the transaction facts that apply to the address.
Where can I review the method and limits?
The publication below identifies the source notes, reporting period, geography, and scope limits used for this analysis.