
Research question
What does this evidence show within this research scope: Institute for Luxury Home Marketing Chicago report-defined luxury segments; exact boundary unstated?
Attached luxury strengthened more sharply than its median price suggests, while price-band differences and incomplete size coverage limit broad conclusions.
Executive summary
- Attached luxury strengthened much more than its price headline suggests. Sales rose 23.5% while inventory fell 13.4%; the sales-to-inventory ratio increased from 35.2% to 50.2%. Median price rose only 1.1%.
- The overall seller-market classification conceals a price gradient. Single-family ratios range from 95.5% below $1.9 million to 25.9% at $2.9 million and above. Attached homes at $2.5 million and above have a 13.7% ratio, in the publisher's balanced range.
- Dramatic ratios require careful denominators. A reported 185% ratio is 24 sales divided by 13 inventory, not a sale probability. Size tables omit 24.3% of attached sales, limiting complete-market claims about square footage.
Scope and assumptions
This study uses the ILHM Luxury Report IL Chicago Sep2026.pdf, pages 2-5. September is the publication month; the main market period is August 2026. The source defines single-family luxury at $850,000 and attached luxury at $750,000. It does not specify its precise Chicago boundary, so these totals are not merged with city or metro totals from other publishers. Historical threshold consistency was not independently verified.
This is original analysis of published aggregate data. It does not use a listing-level MLS database or measure an individual property’s likely outcome.
1. The attached segment improved, while single-family held a higher level
| Measure | Single-family luxury | Attached luxury |
|---|---|---|
| August 2025 inventory | 539 | 568 |
| August 2026 inventory | 518 | 492 |
| Inventory change | -3.90% | -13.38% |
| August 2025 sales | 394 | 200 |
| August 2026 sales | 372 | 247 |
| Sales change | -5.58% | +23.50% |
| Sales / inventory, August 2025 | 73.10% | 35.21% |
| Sales / inventory, August 2026 | 71.81% | 50.20% |
| Change in ratio | -1.28 points | +14.99 points |
| Median price change | +3.59% | +1.06% |
| Median days on market, 2025 to 2026 | 12 to 8 | 14 to 11 |
The distinction between level and momentum matters. Single-family remains higher on this ratio, but attached has the much larger year-over-year improvement. The categories have different price thresholds and property characteristics. This is a descriptive comparison, not evidence that ownership type caused the difference.
The attached ratio's relative increase is 42.58%. That percentage is different from its 14.99-percentage-point increase. Neither describes the probability that a particular listing will sell.
The 13-month history is retained in the chart and downloadable CSV. Both segments were more active relative to inventory in late spring and early summer than in August. A month-to-month decline after that period is not isolated as a structural change or forecast; seasonality and mix have not been controlled.
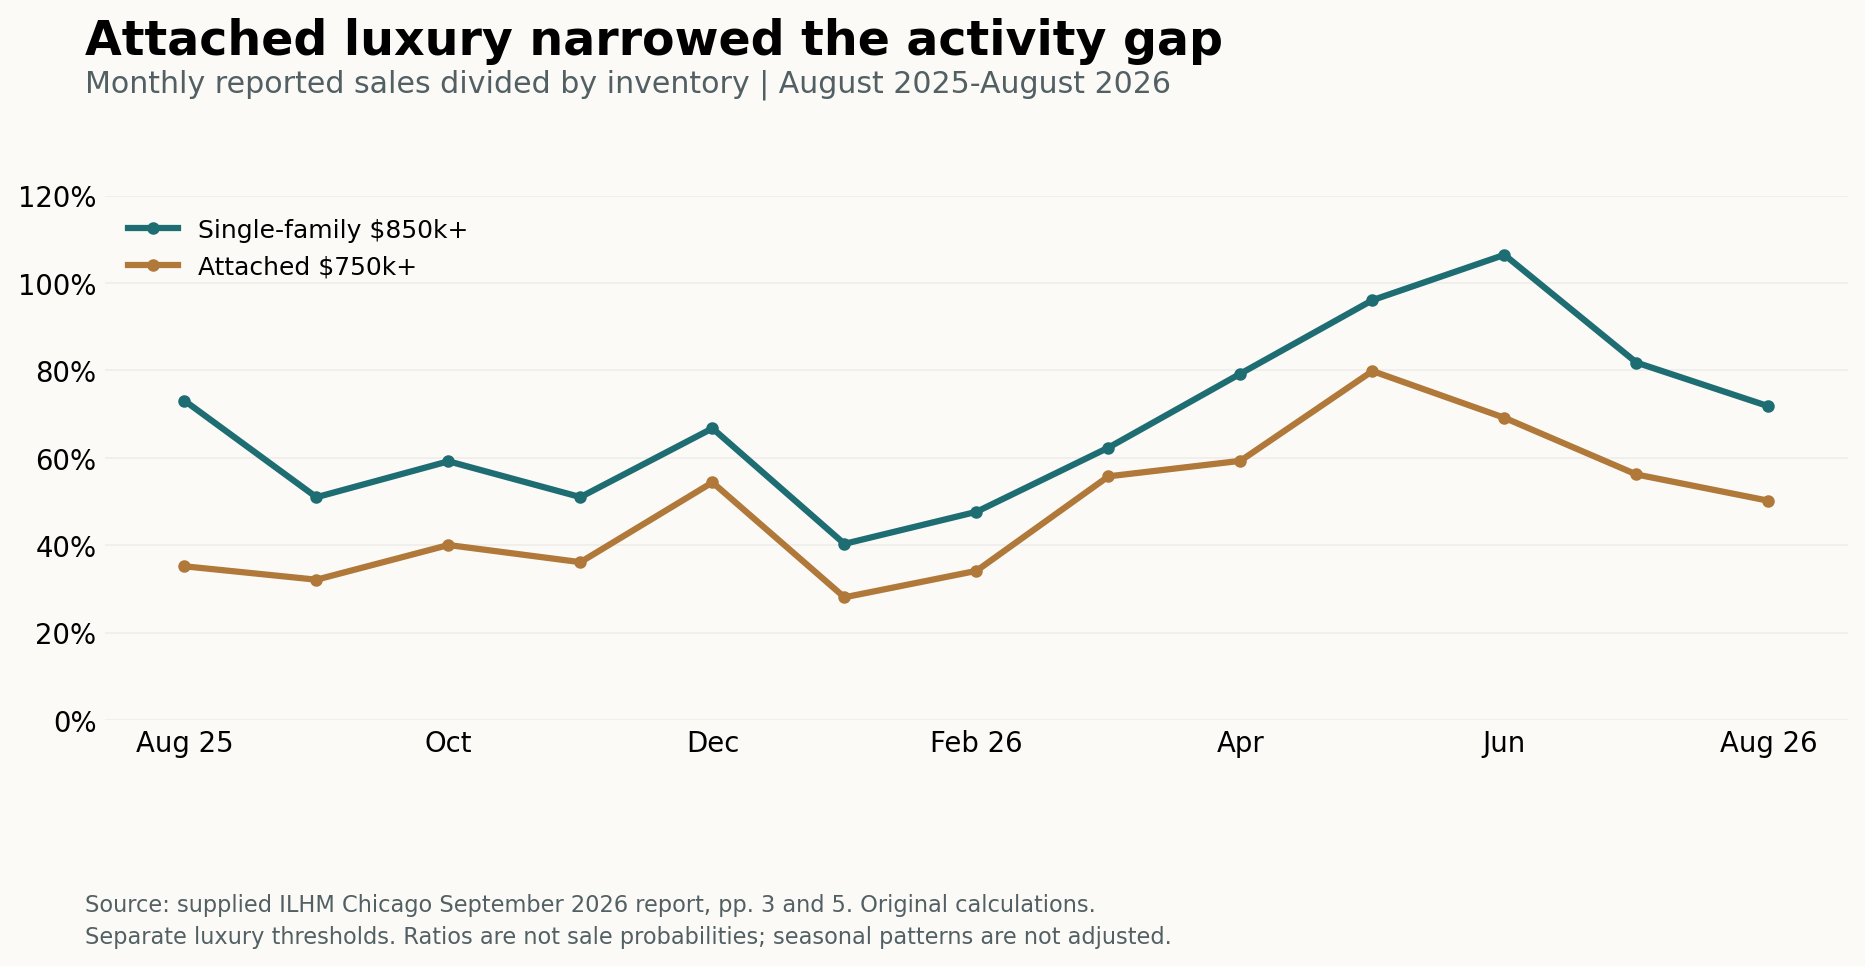
Source: ILHM September 2026 report. Both series compare sales with inventory, not the probability of a sale. Exact monthly values are in the history CSV below.
2. Aggregate classifications hide differences by price
| Property type and price group | Inventory | Sales | Sales / inventory | Classification |
|---|---|---|---|---|
| Single-family: $850k to under $1.9m | 292 | 279 | 95.55% | Seller |
| Single-family: $1.9m to under $2.9m | 110 | 63 | 57.27% | Seller |
| Single-family: $2.9m+ | 116 | 30 | 25.86% | Seller |
| Attached: $750k to under $1m | 202 | 137 | 67.82% | Seller |
| Attached: $1m to under $2.5m | 217 | 100 | 46.08% | Seller |
| Attached: $2.5m+ | 73 | 10 | 13.70% | Balanced |
Original groupings combine mutually exclusive, complete source bins. Inventories and sales are summed separately, then divided. Boundaries are descriptive choices aligned with the published bins, not statistical change points. The publisher's thresholds are buyer below 12%, balanced from 12% to below 21%, and seller at least 21%.
The single-family lower group's ratio is approximately 3.69 times the upper group's. The classification remains seller throughout, but the intensity differs. For attached luxury, the upper group falls into the balanced range. Ten upper-group sales make the result sensitive to a small number of transactions.
Even these groups conceal variation. The two single-family bands beginning at $5.3 million have two sales against 28 inventory, but the $6.5 million-plus band alone has two sales against 16 inventory. Do not describe every upper band as the same market. The attached $3.5 million-plus band has four sales against 40 inventory, also a thin one-month result.
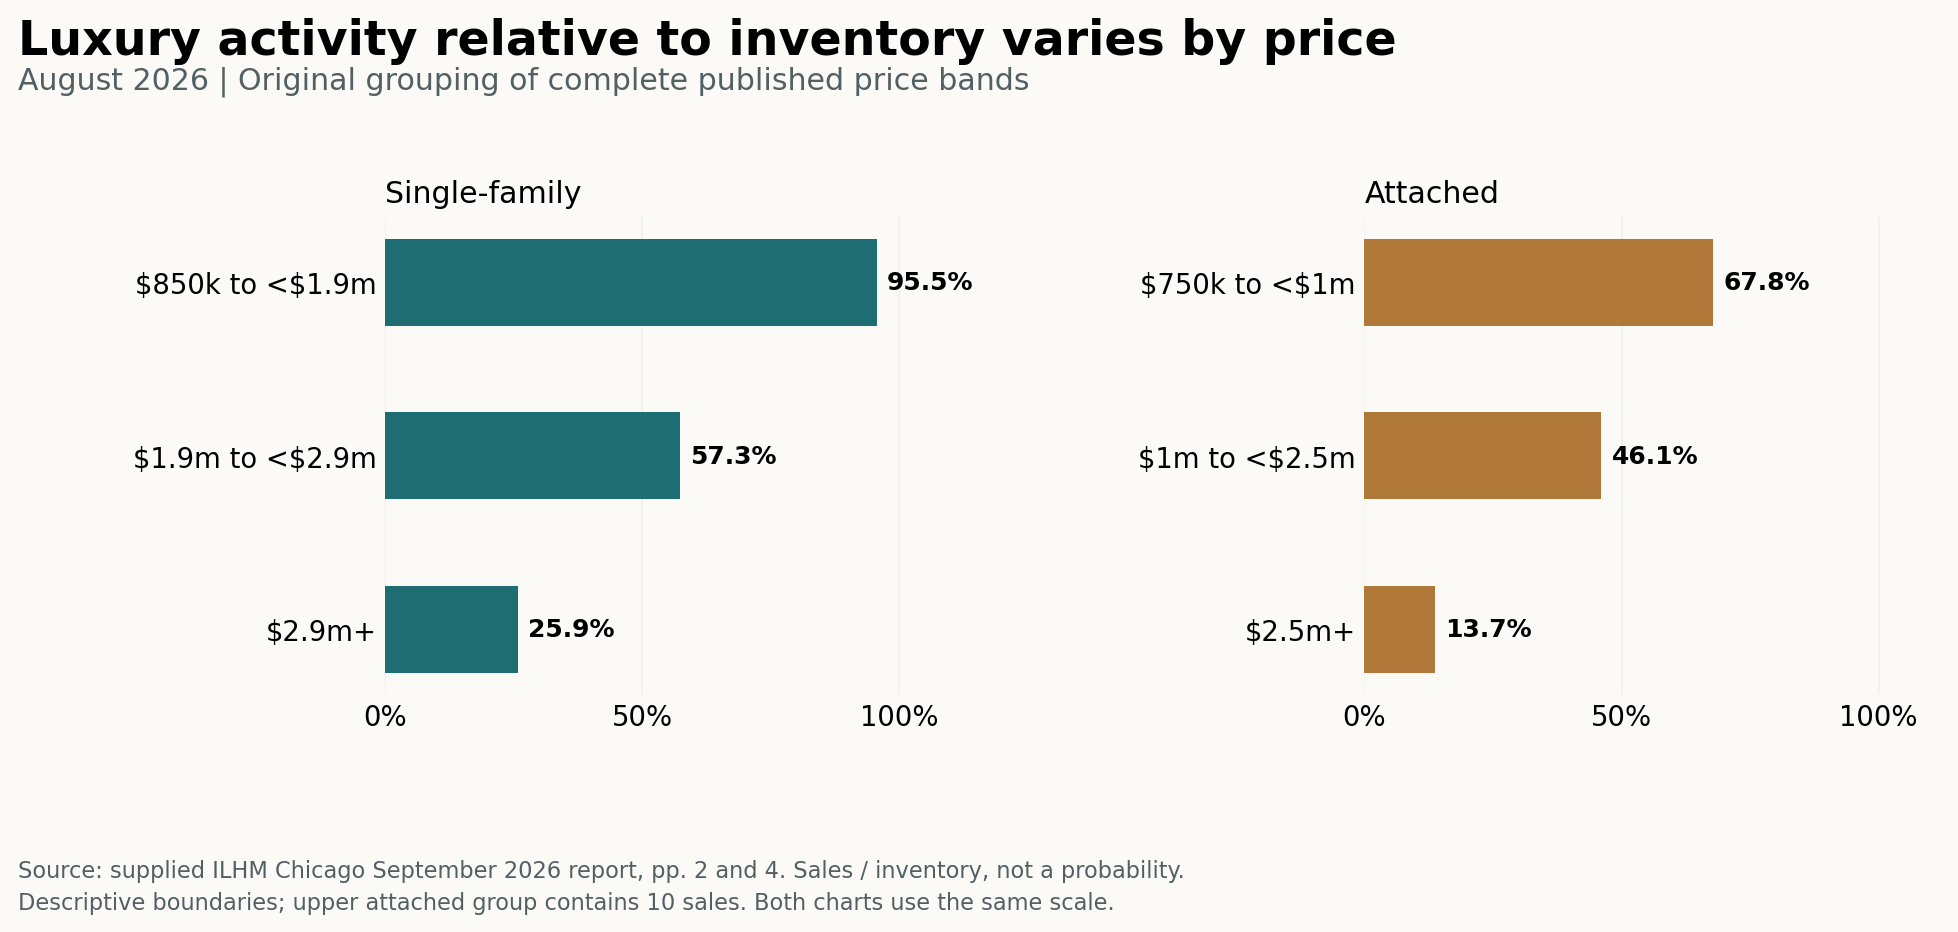
Original groupings of ILHM published price bins; the preceding table supplies the counts. Ratios are not sale probabilities.
3. The striking statistics need explicit denominators
The single-family $1 million to $1,099,999 band produces 24 / 13 = 184.62%, rounded by the publisher to 185%. Three single-family bands and two attached bands exceed 100%. The source explains that reported sales can exceed current inventory. This flow-to-inventory comparison is not a tracked listing cohort.
Likewise, the eight-day single-family median describes the sold population. It does not establish the age of active listings, the share withdrawn, or the outcome of a home listed today. An active-listing age distribution and linked property histories would resolve those questions.
4. Square-foot coverage is incomplete
| Segment | Sales covered by size table | Sales omitted | Omitted share | Inventory omitted |
|---|---|---|---|---|
| Single-family | 332 of 372 | 40 | 10.75% | 22 of 518 |
| Attached | 187 of 247 | 60 | 24.29% | 77 of 492 |
The source footnote excludes records without disclosed square footage. Missingness is larger for sales than inventory in both segments. Size-band ratios describe the observed subset and should not be treated as complete-market estimates. No size-based causal pricing recommendation is made.
Source: ILHM Chicago September 2026 report, pp. 2-5. Both 15-band price tables reconcile exactly to the accepted source totals.
Questions to take to a property search
The segment figures are a starting point for a property-level conversation, not a pricing formula. A buyer or seller can ask how many comparable homes are actually available, which homes entered contract or closed, how asking prices changed, whether concessions or relistings were involved, how property type and construction status differ, and how long homes remained in each status. Those details would help test whether the price-band gradient persists after accounting for composition and whether quickly sold homes coexist with older unsold inventory.
The current report does not contain linked listing histories, final asking prices, concessions, relistings, or time in each status. It therefore supports the narrower findings in this study and does not support a forecast or a claim about the likely outcome for a particular property.
Sources and methods
Primary document: Institute for Luxury Home Marketing, ILHM Luxury Report, Chicago, September 2026, pages 2–5. The edition reports August 2026 activity, with comparisons to August 2025 and a 13-month history. The source report was provided for this research; a public report URL is not available in the source record. Source observations were recorded September 26, 2026. That retrieval date does not change their reporting period.
The report defines single-family luxury at $850,000+ and attached luxury at $750,000+. Its exact geographic boundary and historical threshold consistency are not established. The series must not be relabeled Chicago-city-only, applied to an individual suburb, or joined to a different publisher’s city totals. Attached is not silently relabeled condominium-only.
- Annual change: (August 2026 value / August 2025 value − 1) × 100. Percentage-point changes subtract two percentage readings; they differ from relative percentage growth.
- Sales-to-inventory ratio: reported sales / reported available inventory. This compares a transaction flow with inventory; ratios over 100% are possible and are not sale probabilities.
- Price groups: sum sales and inventory separately across mutually exclusive complete source bins, then divide the totals. The groups exhaust the source’s 15 bands per property category. Do not average band percentages. Boundaries are descriptive, not estimated causal thresholds.
- Classification: the source defines buyer below 12%, balanced at least 12% but below 21%, and seller at least 21%. Group classifications apply those rules to unrounded ratios.
- Size coverage: included size-table counts / overall counts. Undisclosed square footage is excluded by the source; missingness is not assumed random. Size-based results describe only the disclosed subset.
Both price-band tables reconcile to their published sales and inventory totals. The downloadable history retains all 13 observations and the attached December median of $1,000,016 exactly as printed. No seasonality adjustment, property-level matching, causal test, appreciation estimate, sale-probability model or price forecast is claimed.
The CSV downloads preserve the report observations and our derived comparisons for reuse with these definitions. They contain aggregate research data, not Jeff’s proprietary listing or client database.
Questions about this research
What question does this research answer?
It examines this scope: Institute for Luxury Home Marketing Chicago report-defined luxury segments; exact boundary unstated. The research period is August 2026, with August 2025 comparison and 13-month history. Attached luxury strengthened more sharply than its median price suggests, while price-band differences and incomplete size coverage limit broad conclusions.
Can this research set a price or offer for a specific property?
No. This is point-in-time research for the stated scope; a property-specific decision still requires current comparables, the property's condition, and the transaction facts that apply to the address.
Where can I review the method and limits?
The publication below identifies the source notes, reporting period, geography, and scope limits used for this analysis.