
Research question
What does this evidence show within this research scope: Zillow seasonally adjusted city inventory and new-listing series for Chicago, Elmhurst, and Glen Ellyn; three-city complete-case sample?
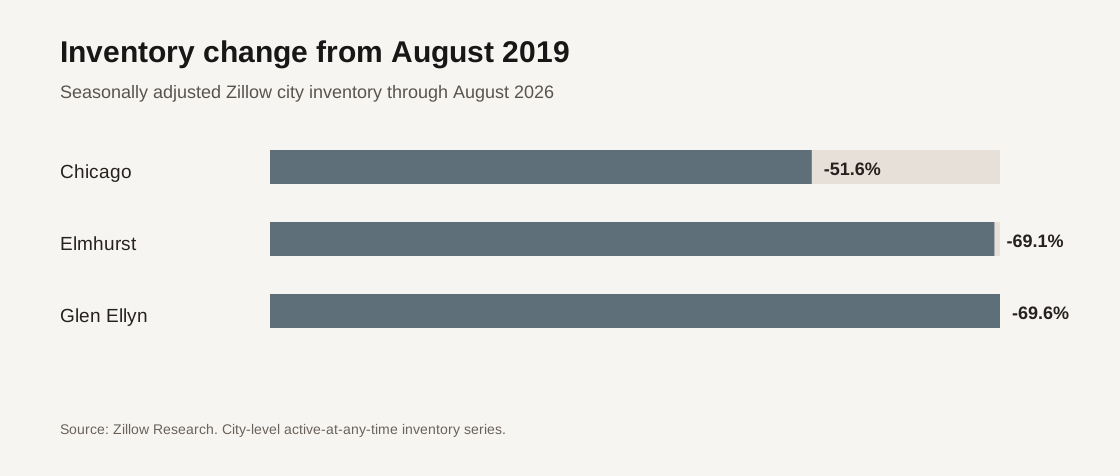
All three complete city series had more new listings than a year earlier, but August 2026 inventory remained 51.7% to 69.6% below August 2019. New listing flow and available inventory answer different questions.
Executive summary
- Chicago, Elmhurst, and Glen Ellyn each had more new listings in August 2026 than in August 2025.
- Inventory did not move uniformly. It fell 8.4% in Chicago but rose 23.1% in Elmhurst and 18.3% in Glen Ellyn from the prior year.
- Despite those one-year changes, August 2026 inventory remained 51.7% below August 2019 in Chicago and about 69% below in both suburbs.
Complete observations only
The retained Zillow inventory and new-listings files contain complete August 2019, 2025, and 2026 observations for Chicago, Elmhurst, and Glen Ellyn. Hinsdale and Clarendon Hills have at least one blank required observation. Western Springs has no exact city row in the retained new-listings file.
Those three cities are excluded from this study. Their missing observations are not converted to zero, carried forward, or replaced with county data.
| City | Inventory: 2019 | Inventory: 2025 | Inventory: 2026 | 2019 to 2026 | 2025 to 2026 |
|---|---|---|---|---|---|
| Chicago | 11,533 | 6,088 | 5,576 | -51.65% | -8.41% |
| Elmhurst | 362 | 91 | 112 | -69.06% | +23.08% |
| Glen Ellyn | 319 | 82 | 97 | -69.59% | +18.29% |
| City | New listings: 2019 | New listings: 2025 | New listings: 2026 | 2019 to 2026 | 2025 to 2026 |
|---|---|---|---|---|---|
| Chicago | 2,903 | 1,993 | 2,137 | -26.39% | +7.23% |
| Elmhurst | 71 | 37 | 46 | -35.21% | +24.32% |
| Glen Ellyn | 68 | 41 | 44 | -35.29% | +7.32% |
More new listings did not produce the same inventory result
New listings are a flow into the market. Inventory counts unique listings active at any time in the month. A property can enter as a new listing and then leave inventory through a contract, withdrawal, expiration, or another status change.
That distinction helps explain why all three cities could record year-over-year growth in new listings while only two recorded more inventory. The public city series do not link the same properties across statuses, so the calculation cannot assign a reason for the difference.
The 2019 baseline changes the interpretation
Looking only at 2025 to 2026 would show inventory growth in Elmhurst and Glen Ellyn. The August 2019 comparison shows that both remained about 69% below their earlier levels. Chicago inventory was down about 52% from 2019 and also fell from 2025.
This is not a claim that the market should return to 2019. The earlier month is a consistent pre-2020 reference point, not an equilibrium target. Changes in housing stock, listing practices, market participation, and Zillow coverage can matter.
Buyer and seller questions
For a buyer, more inventory does not establish that more homes fit the search criteria. The next step is to count current matches by property type, location, condition, price, and status.
For a seller, lower broad inventory does not prove that every home faces limited competition. Direct active and pending alternatives, pricing histories, concessions, and withdrawn listings are needed to understand the actual competitive set.
Sources, calculation, and limits
- Zillow Housing Data supplies seasonally adjusted city inventory and new-listing series.
- Annual and baseline change = (later observation / earlier observation - 1) x 100.
- The study uses 18 exact source observations: three cities, two metrics, and three August dates.
Zillow defines for-sale inventory as unique listings active at any time in a month and new listings as homes newly entering the market. The series are not a linked property cohort. This study does not measure sales, pending contracts, withdrawals, buyer demand, individual property availability, causation, or a forecast.
Questions about this research
What question does this research answer?
It examines this scope: Zillow seasonally adjusted city inventory and new-listing series for Chicago, Elmhurst, and Glen Ellyn; three-city complete-case sample. The research period is August 2019, August 2025, and August 2026. All three complete city series had more new listings than a year earlier, but August 2026 inventory remained 51.7% to 69.6% below August 2019. New listing flow and available inventory answer different questions.
Can this research set a price or offer for a specific property?
No. This is point-in-time research for the stated scope; a property-specific decision still requires current comparables, the property's condition, and the transaction facts that apply to the address.
Where can I review the method and limits?
The publication below identifies the source notes, reporting period, geography, and scope limits used for this analysis.