
Research question
What does this evidence show within this research scope: Zillow city all-homes ZHVI and median sale price for Chicago, Elmhurst, Glen Ellyn, and Hinsdale?
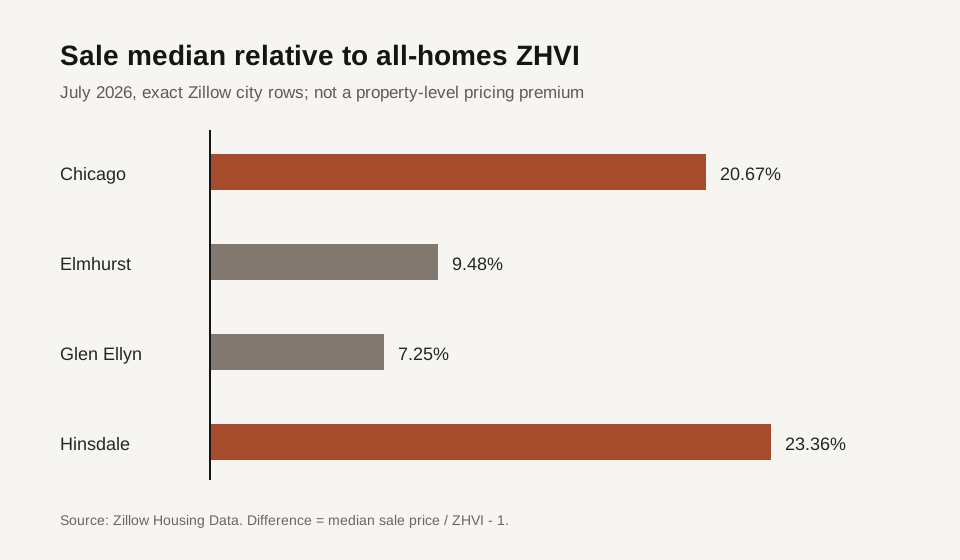
Median sale price exceeded all-homes ZHVI by 7.3% to 23.4% in the four cities with complete July observations. The gaps describe different populations and do not measure an error or property-level premium.
Executive summary
- Zillow's July 2026 median sale price exceeded its all-homes ZHVI in Chicago, Elmhurst, Glen Ellyn, and Hinsdale.
- The observed gaps ranged from 7.25% in Glen Ellyn to 23.36% in Hinsdale.
- The comparison does not show that ZHVI was wrong by those amounts. ZHVI describes the modeled typical value of a broader housing stock, while median sale price describes the middle price among homes reported sold during the month.
The four-city comparison
| City | July all-homes ZHVI | July median sale price | Dollar gap | Sale median relative to ZHVI |
|---|---|---|---|---|
| Chicago | $331,470 | $400,000 | +$68,530 | +20.67% |
| Elmhurst | $637,081 | $697,500 | +$60,419 | +9.48% |
| Glen Ellyn | $575,745 | $617,500 | +$41,755 | +7.25% |
| Hinsdale | $1,286,919 | $1,587,500 | +$300,581 | +23.36% |
The measures use different populations
Zillow Housing Data defines ZHVI as a measure of typical home value and market change for a region and housing type. The middle-tier index reflects homes in the 35th to 65th percentile range. Zillow defines sale price as the price at which homes were sold and notes that the latest sale month can be estimated to account for reporting latency.
The retained city median-sale-price file ended in July 2026, so this report matches both series on July 31. It does not substitute August ZHVI for a missing August sale-price observation.
The difference matters because the set of homes that sold in one month can have a different mix of price points, property types, locations, conditions, and sizes than the broader housing stock represented by an index. A monthly sale median can move when that transaction mix changes even if no individual home changed by the same percentage.
A gap is not an accuracy score
Hinsdale had the largest dollar and percentage gap in this complete-case sample. That does not establish that one measure was 23.36% too high or too low. The two values answer different questions.
Nor can the city gap be applied to an individual Zestimate, listing, appraisal, or offer. A subject property needs direct comparable evidence and its own physical, location, condition, and timing adjustments.
Why only four cities appear
The retained median-sale-price file had exact Illinois city rows for Chicago, Elmhurst, Glen Ellyn, and Hinsdale. It did not contain exact rows for Western Springs or Clarendon Hills. Those cities were excluded rather than replaced with county data or a similarly named geography.
The sample includes four city rows and one matched date per measure. It is not a transaction-level dataset, and the public file does not expose the number or distribution of sales behind each city median in this extract.
How to use the comparison
A buyer or seller can use the result as a measurement check. Before comparing two price headlines, ask whether each number is a modeled value, listing measure, completed-sale measure, or matched-property ratio. Then keep the geography, property type, and period aligned.
For an individual home, review recent comparable sales, current alternatives, property condition, size, location, price history, concessions where available, and transaction timing. The city figures are context for that work, not a replacement for it.
Sources, calculation, and limits
- Zillow Housing Data supplies the smoothed, seasonally adjusted all-homes city ZHVI and raw all-homes city median sale-price files.
- Zillow's current ZHVI methodology explains that ZHVI is designed to cover typical property values across the housing stock, not only homes sold in a month.
- Gap percentage = (median sale price / ZHVI - 1) x 100.
- Four exact Illinois city rows with complete July 31, 2026 observations were used. No missing city was replaced or imputed.
This report does not measure a property's market value, an appraisal, model error, sale-to-list ratio, investment return, forecast, causal effect, indexing, rankings, AI citations, or inquiries. Zillow can revise its published series.
Questions about this research
What question does this research answer?
It examines this scope: Zillow city all-homes ZHVI and median sale price for Chicago, Elmhurst, Glen Ellyn, and Hinsdale. The research period is July 31, 2026. Median sale price exceeded all-homes ZHVI by 7.3% to 23.4% in the four cities with complete July observations. The gaps describe different populations and do not measure an error or property-level premium.
Can this research set a price or offer for a specific property?
No. This is point-in-time research for the stated scope; a property-specific decision still requires current comparables, the property's condition, and the transaction facts that apply to the address.
Where can I review the method and limits?
The publication below identifies the source notes, reporting period, geography, and scope limits used for this analysis.