
Research question
What does this evidence show within this research scope: Redfin county archive, all residential, 30-day, not seasonally adjusted; broad historical county context?
The three counties had similar average sale-to-list ratios and price-drop shares, but DuPage and Lake moved off market within two weeks more often than Cook in the May 2026 archive.
Executive summary
- Average sale-to-list ratios were close: 101.32% in Cook, 101.44% in DuPage, and 101.52% in Lake County.
- The share sold above list ranged from 48.64% in Cook to 52.34% in DuPage. Those shares are not probabilities for a future listing.
- The share going off market within two weeks was 52.09% in Cook, 63.97% in DuPage, and 62.51% in Lake County.
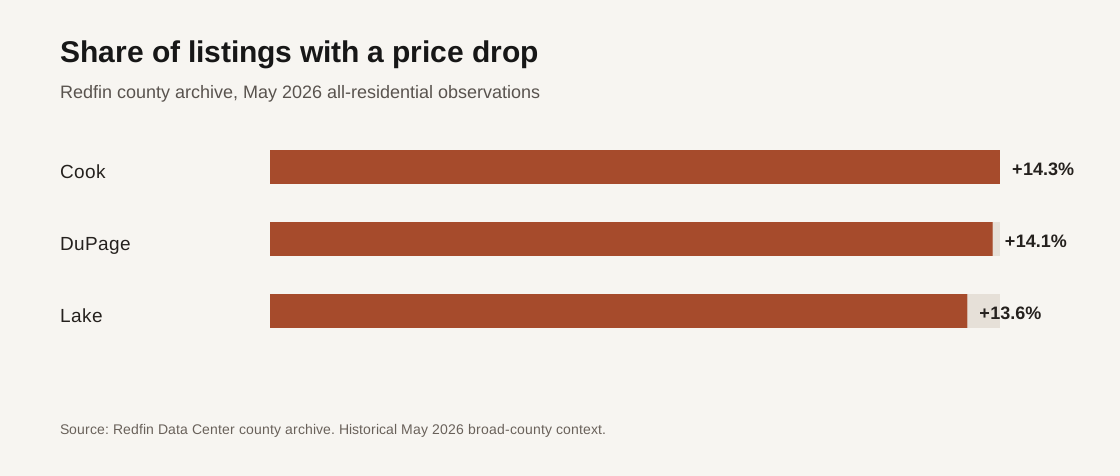
- Price-drop shares were also close, ranging from 13.63% in Lake to 14.26% in Cook.
One month, several negotiating signals
| County | Median sale price | Inventory | Inventory change | Months of supply | Median days on market |
|---|---|---|---|---|---|
| Cook | $390,000 | 14,057 | -8.26% | 2.8 | 46 |
| DuPage | $460,000 | 2,429 | +2.19% | 2.6 | 42 |
| Lake | $434,429 | 2,055 | -2.42% | 2.6 | 45 |
| County | Average sale to final list | Sold above list | Price drops | Off market in two weeks |
|---|---|---|---|---|
| Cook | 101.32% | 48.64% | 14.26% | 52.09% |
| DuPage | 101.44% | 52.34% | 14.12% | 63.97% |
| Lake | 101.52% | 49.94% | 13.63% | 62.51% |
Similar price-drop shares did not mean identical market speed
The three price-drop shares fit within a 0.64-percentage-point range. The two-week off-market shares spanned 11.88 points, from Cook to DuPage.
Those measures describe different stages. Redfin defines a price drop as an active listing reducing its asking price below the original ask. Its off-market-within-two-weeks measure concerns homes that went under contract within 14 days. A county can therefore show a similar rate of price reductions while moving a different share of new listings into contract quickly.
The sale-to-list ratio needs its own denominator
Redfin calculates the average ratio using each sold home's final sale price and final list price, with outlier exclusions. A 101.5% county average does not mean every buyer paid 1.5% over asking. It also does not reveal the original list price, concessions, credits, repairs, financing terms, or the distribution around the average.
The separate sold-above-list share shows that about half of sales closed above final list in each county. That still does not tell us how many offers a property received or whether price changes occurred before the final ask.
Broad counties are context, not a suburb comparison
Cook, DuPage, and Lake Counties contain many distinct cities, neighborhoods, property types, and price ranges. Chicago is part of Cook County, while Elmhurst, Hinsdale, Glen Ellyn, and Clarendon Hills are associated with DuPage County geography. County data cannot be relabeled as a result for any one community.
For a buyer or seller, the useful next step is a direct comparison of current alternatives and recent transactions matching the property's location and type. County figures can identify which questions to ask about speed, pricing history, and competition. They cannot determine an offer or asking price.
Sources, calculation, and limits
- Redfin Data Center downloads supplied the retained county archive.
- Redfin metric definitions define sale-to-list ratio, days on market, price drops, months of supply, and two-week contract speed.
- Redfin methodology explains the market tracker and source revisions.
- Exact filter: county region, all residential, 30-day period, not seasonally adjusted, period ending May 31, 2026.
The retained archive was last updated June 2, 2026. This is explicitly historical May context, not a September market claim. Redfin data can be revised. The study does not measure a specific suburb, property, concession, multiple-offer count, future outcome, causation, or forecast.
Questions about this research
What question does this research answer?
It examines this scope: Redfin county archive, all residential, 30-day, not seasonally adjusted; broad historical county context. The research period is May 1 to May 31, 2026. The three counties had similar average sale-to-list ratios and price-drop shares, but DuPage and Lake moved off market within two weeks more often than Cook in the May 2026 archive.
Can this research set a price or offer for a specific property?
No. This is point-in-time research for the stated scope; a property-specific decision still requires current comparables, the property's condition, and the transaction facts that apply to the address.
Where can I review the method and limits?
The publication below identifies the source notes, reporting period, geography, and scope limits used for this analysis.